
Free tools to determine demand for your products and services using search data
)
If an event professional had a crystal ball, they could tell you if it was a good idea to mothball your business and if you did, they could tell you when you should come out of hibernation to promote your products and services again.
If you’re adapting your company to cater for a new type of event for the new normal, they could tell you the demand for it and how much money and time you should invest in your new product line and the best time to do it.
We usually think of SEO agencies as partners that help us get qualified website visitors to sell more of our products and services. Yet, they could also be fortune tellers we’re looking for.
I work for Patch, a full-service marketing agency that specialises in SEO. We have a lot of clients in the events, leisure and hospitality industries and lately we’ve been using search data to help our clients plan for uncertain times ahead. I want to share the methodology we’ve been using and some free DIY tools to allow you, through the power of search, to determine what you should do with your business and when.
The Free Tools
There are loads of free tools on the web that will allow you to check search history and forecasts by topics and individual keywords. I would recommend reading through the methodology of each before you go and click install.
Google Trends
Google Trends does what you’d expect. Its strapline is ‘Explore what the world is searching’. You choose a location, date period, search type and compare different keywords. For the majority of this year in the UK Conference News has had more interest than ‘venue to hire’. We can’t wait for things to go back to normal and venues to be more popular than news again.
Be aware of how the metrics are calculated before you use the data to make decisions. Google Trends reports on the interest in a keyword being searched. The numbers represent search interest relative to the highest point on the chart (for the given region and time). A value of 100 is the peak popularity for the term. A value of 50 means that the term is half as popular. A score of 0 means that there was not enough data for this term. It may not report the exact number of searches, but the data is based on searches performed and the comparison feature is great.
Google Keyword Planner
Google’ free keyword planning tool will tell you the search volume history for keywords over a period of time and will even forecast searches into the future. Make sure you’re aware of how Google calculates its forecasts if you’re going to use this data to shape decisions.
It’s meant for Google Ads and therefore provides a forecast in clicks, click through rate (CTR) and cost per click (CPC) but this can be used to understand the full search volume.
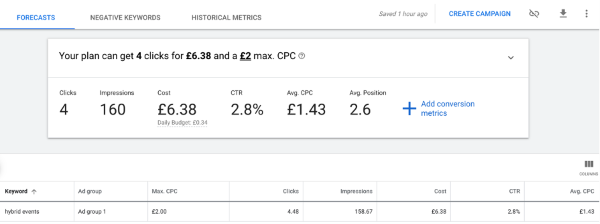
The example forecast below, generated the last week of September 2020 for searches for ‘hybrid events’ in October 2020 suggests a Google Ads campaign for the keyword ‘hybrid events’ could generate 160 impressions in October (our advert will appear in search results 160 times). A Google Ads campaign rarely gets a full 100% share of impressions (the percentage of searches your ad gets served for out of all the searches made for a given keyword) so I’d be comfortable assuming 160 is a minimum level of searches that will take place next month for ‘Hybrid events’.
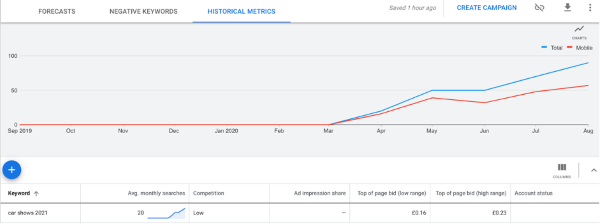
The past can sometimes help predict the future and Google’s keyword planning tool also shows historical searches. The example below shows the history in search volume for ‘car shows in 2021’. For anyone that organises car shows this data would be as useful to watch as the government’s announcements.
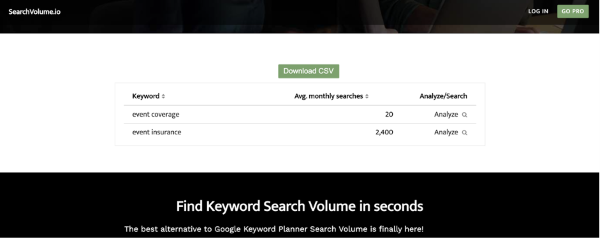
Searchvolume.io
searchvolume.io is a useful alternative to Google. It allows up to 800 keyword checks per day and provides average monthly search volumes. That is a measure of the total number of searches that are performed through search engines, expressed as the average monthly volume from the previous 12-month period.
Searchvolume.io is a good tool to countercheck against Google’s data and helpful for understanding if averages have been driven up or down by external events. More people performed event insurance-related searches in the first half of 2020 than in 2019 so the average number of searches is higher than ever before, but event insurance companies sold less insurance in 2020 than ever before.
The all-time peak for broad searches (i.e. searches that cover a broad query) related to event insurance was in March 2020, by taking into account external events it’s easy to disregard trends and realise that March 2020 wasn’t an ideal time to open an event insurance company, even if searches suggested demand was at an all-time high.
Uber Suggest
Uber Suggest is a great tool if you’re getting hooked on checking search data. It’s a free browser plugin for Chrome and analyses search patterns as you perform searches in Google. It also tells you a traffic estimate (often wrong when looking at searches with low volumes, but it’s a reasonable guide) and the authority score (useful in SEO) of the websites that rank. It also provides a little analysis on Facebook and Twitter within the organic search results which is a nice feature.
Best of all, it suggests keywords related to the ones you’re searching and is useful to help expand your research and come up with more keyword related to your business. You can also export your search data to piece together many searches and keywords into a larger forecast.
To help you keep up to date with industry news and trends in your ever-changing career register free for the Knowledge Hub.